Team
Context
For the second year, my school (EDNA) and Audencia SciencesCom made a partnership to create data visualization using metaphor through photographs. The subject of this year was to communicate about the Loire-Atlantique (French department) using their data. We made two posters by team in order to print a magazine.
Project
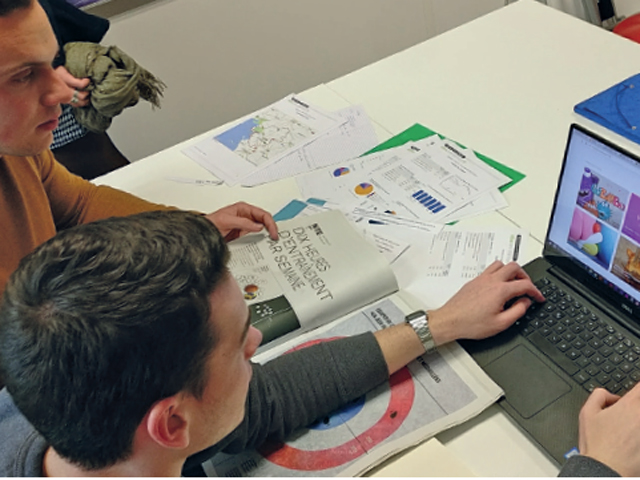 Me and Thibaut analyzing data.
We chose two subjects randomly that were the Sport and the Mobility in Loire-Atlantique. We had a database about those subjects. The idea was to find out some interesting data to have something to show to people, a message to deliver using a powerful photograph.
 The poster about Mobility.
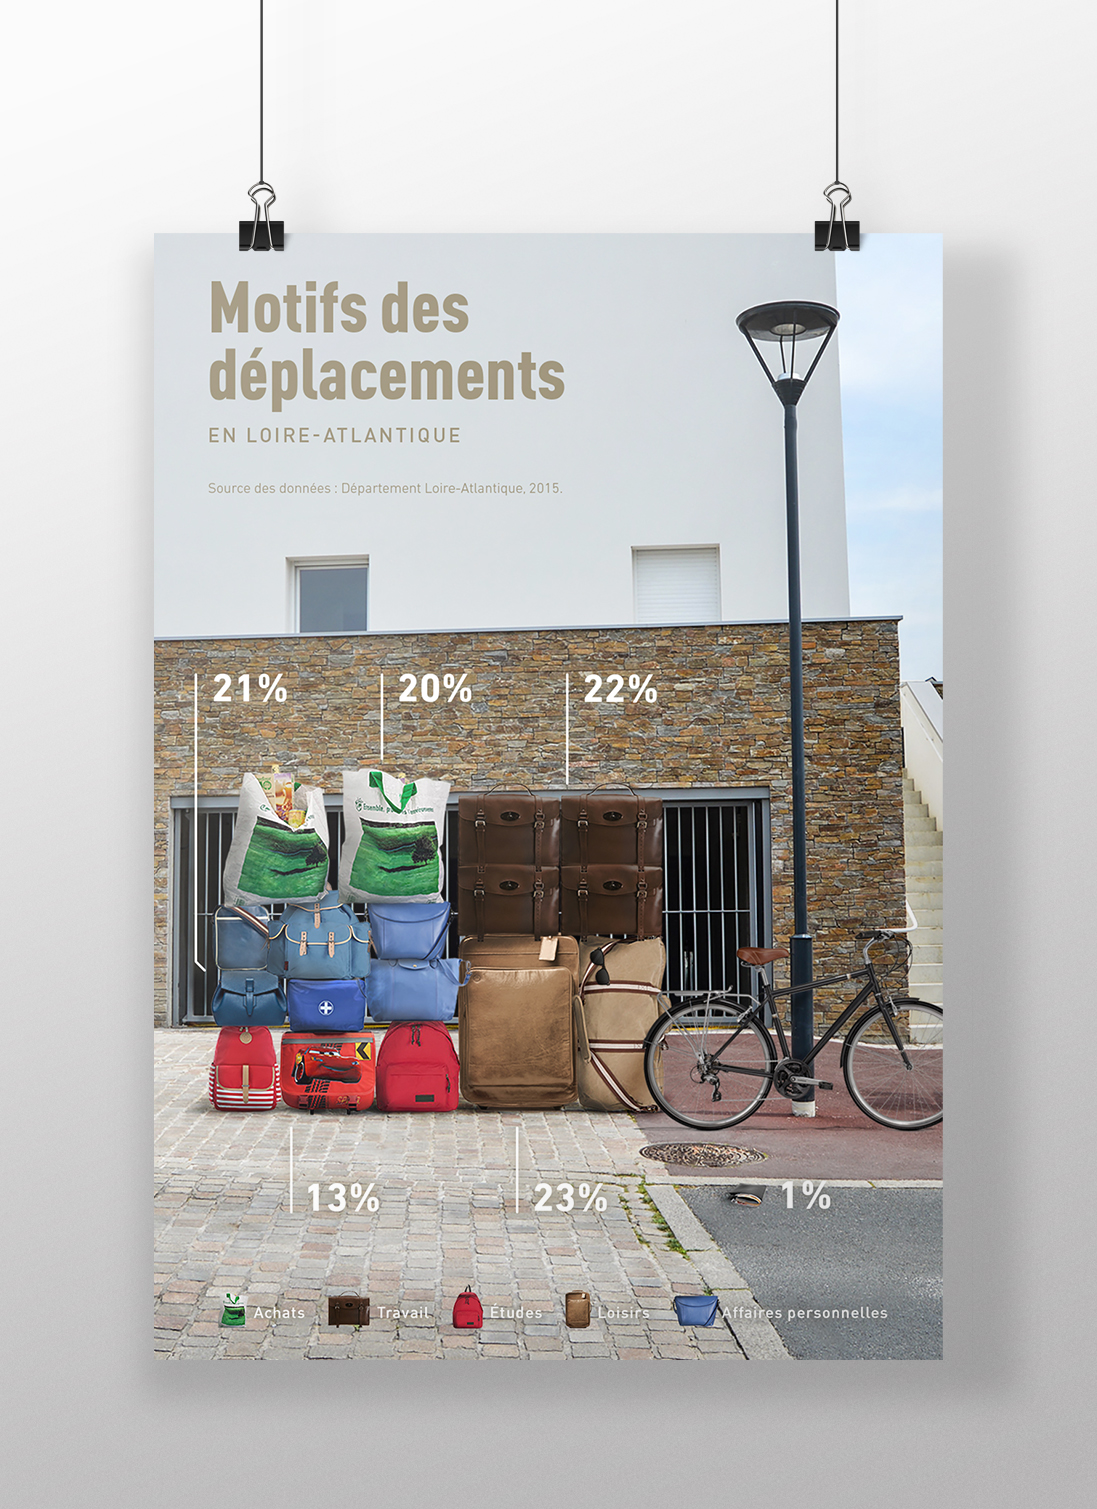
The first poster is about Mobility. It is interesting to show to people that their trip are not just about work but also a lot about spare time. We used pieces of luggage organized into a treemap shape to make people quickly understand the meaning behind the photograph. The bike give the final touch to show the mobility.
 The poster about Sport.
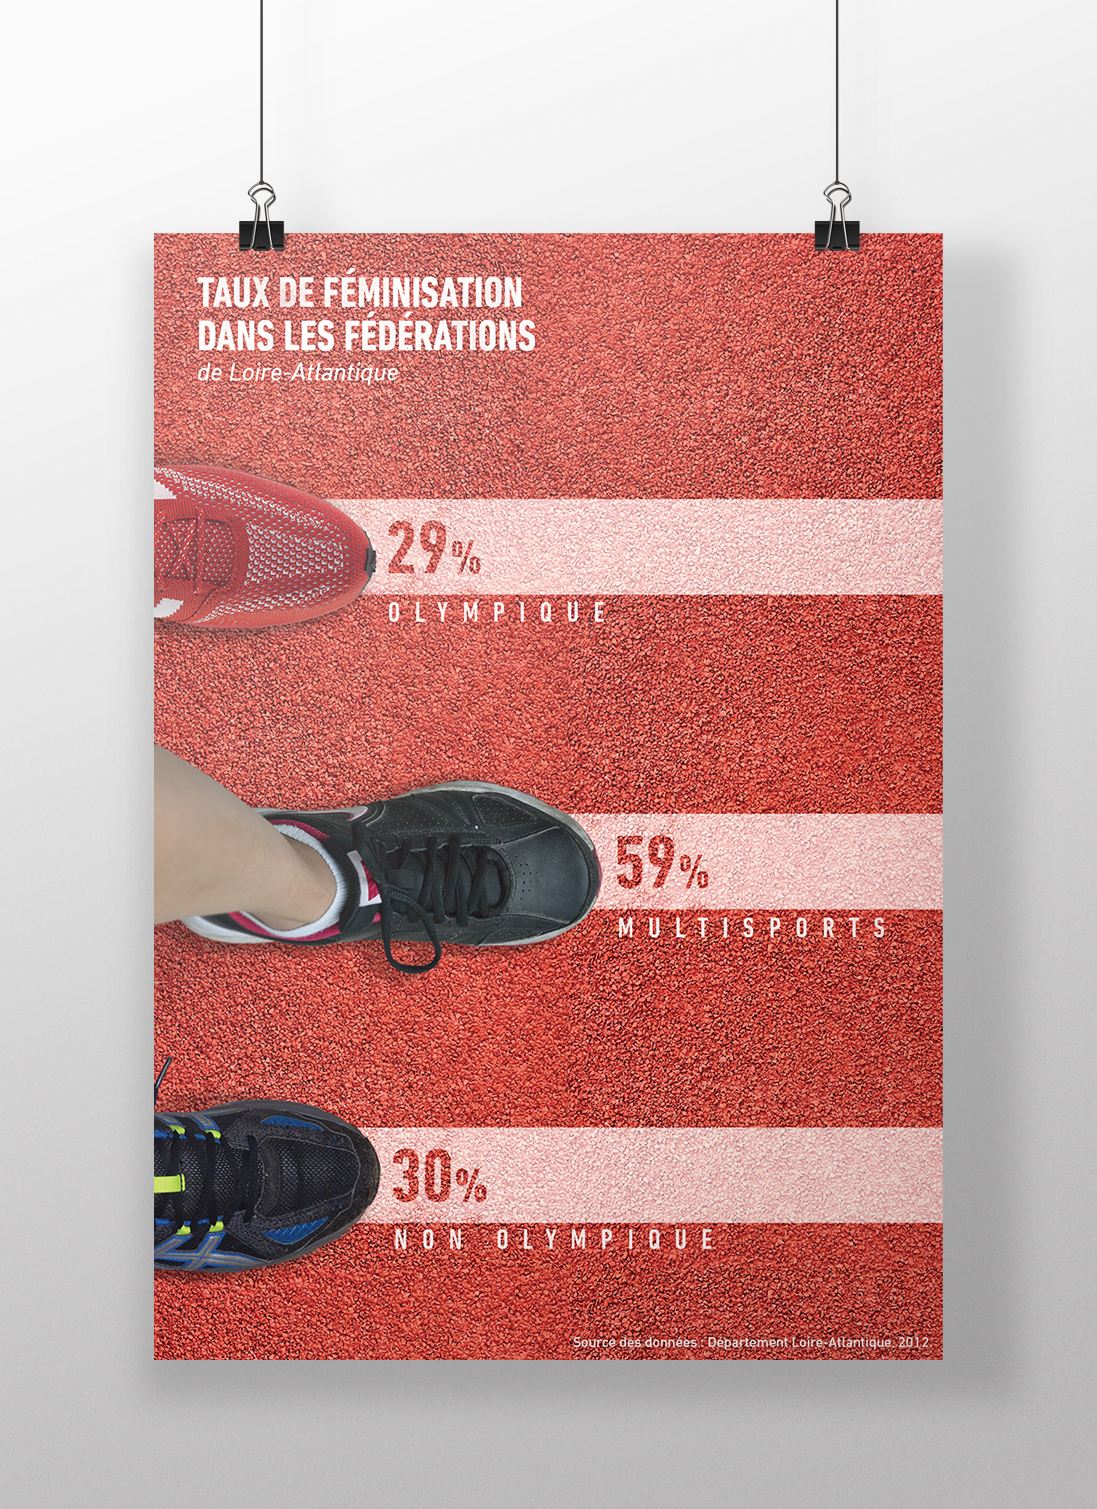
The second poster is about Sport. A lot of people think that sport, and even more in the profressional area, is a men stuff. We wanted to show that women are in the game and that in the Multi-Sport field is dominated by them in our department. We had to work about the woman representation in the picture without making a cliché.
 The printed posters in magazines.
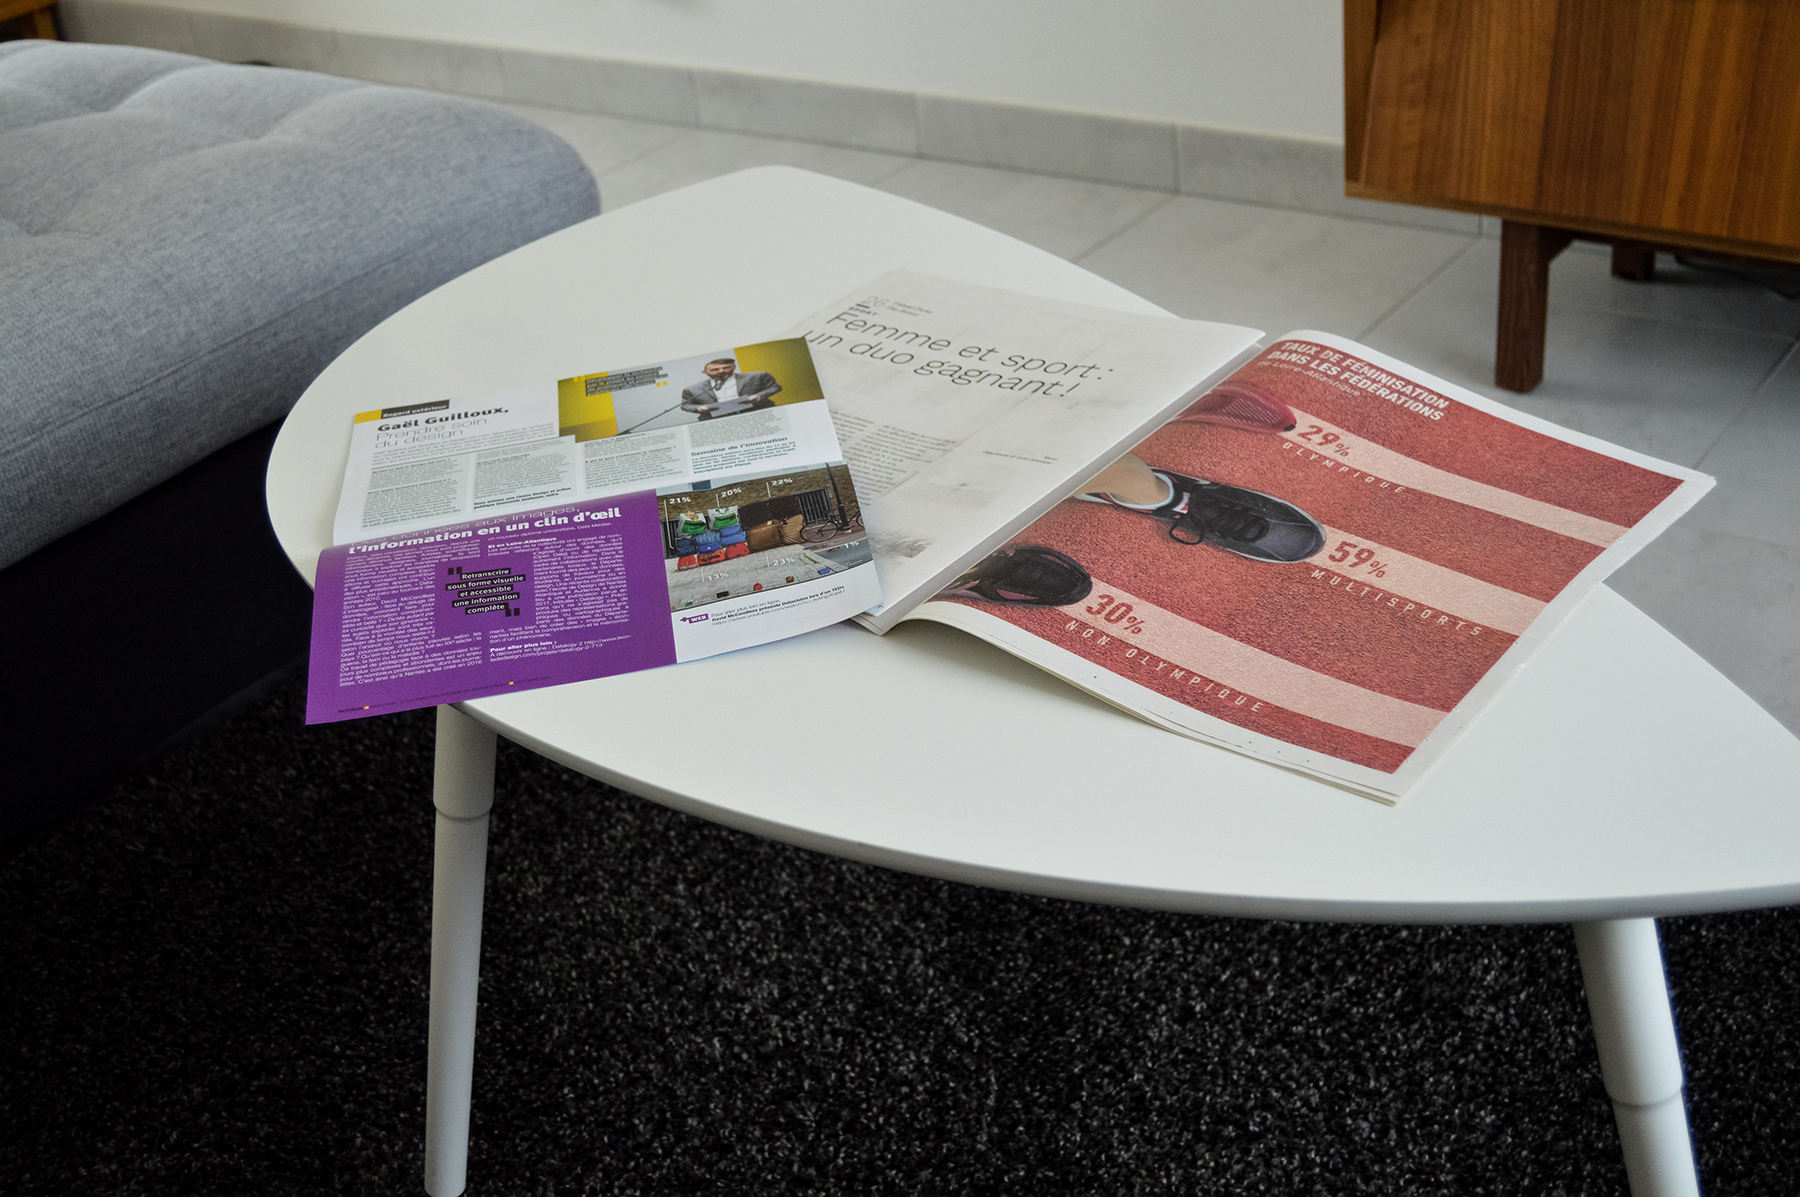
Our two posters were released into the Datalogy #2 magazine and also displayed during the Datarama #2 party, an event around the data, organized during the Nantes Digital Week in 2017. The poster about Mobility was published in a Loire-Atlantique magazine.